Search
Close this search box.
Search
Close this search box.
Search

Explanation of heart rate variability (HRV) parameters

Introduction

Es gibt verschiedene Parameter der Herzfrequenzvariabilität (HRV). We present the most important ones with a brief explanation. A distinction is made between time-based parameters and frequency-based parameters.

How an evaluation of the parameters can look in reality, you can see in the screenshot. This is the analysis of a HRV measurement from our Mindfield eSense app. A look at the different parameters gives an indication of how the heart rate variability of a user of our eSense Pulse looks like.

Particularly interesting is not only the momentary state of the measured values at the time of a measurement, but also the change of the measured values over a certain time and several measurements. Biofeedback training can improve heart rate variability. This should also show up in the individual HRV parameters over time.

Statistik Deutsch
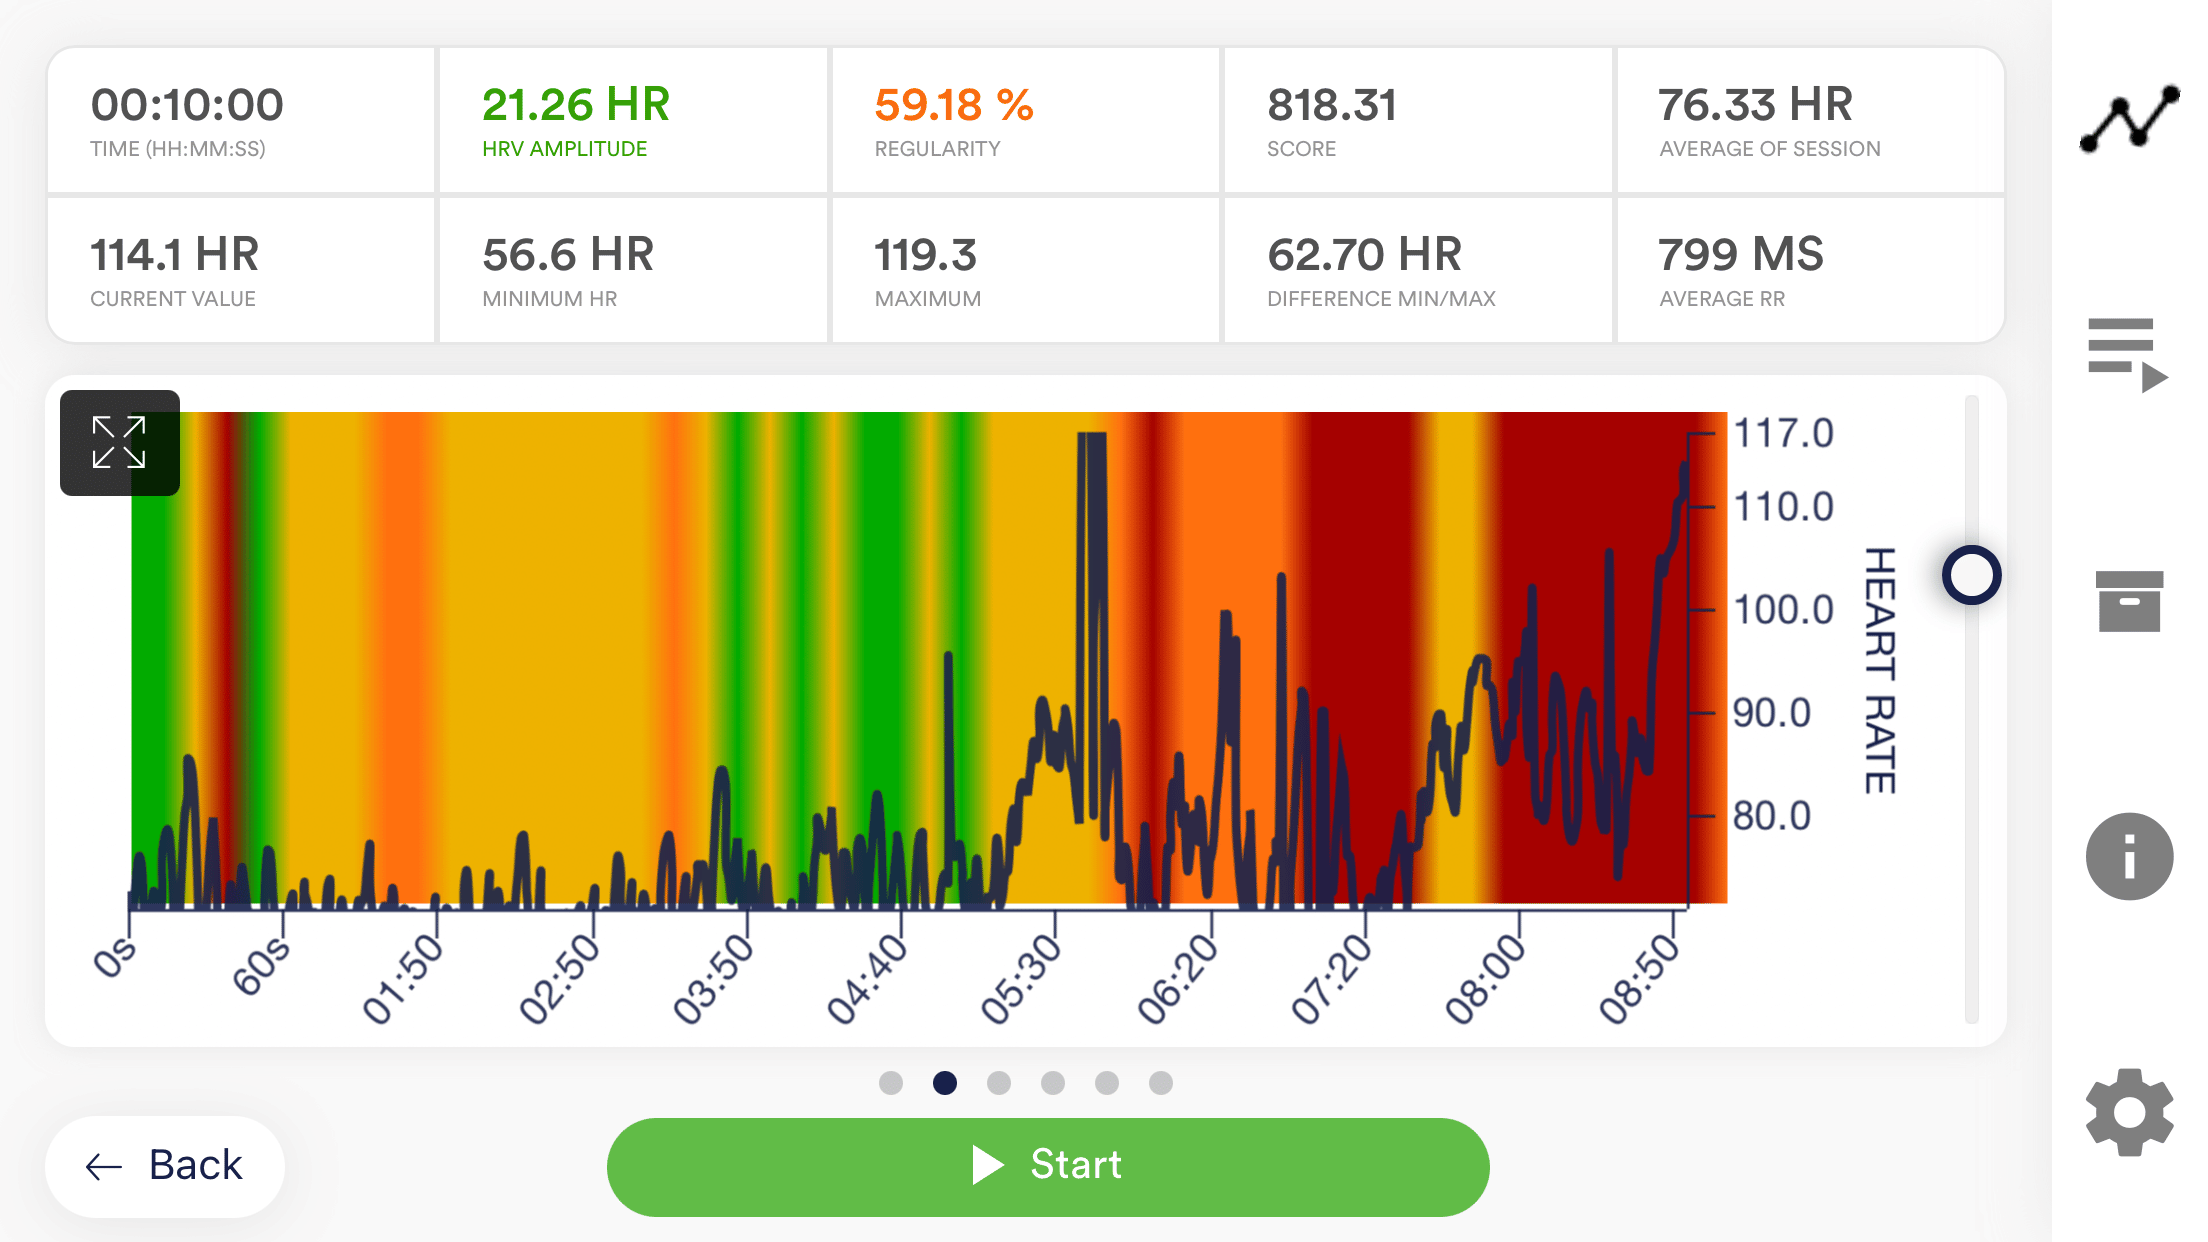
The different HRV parameters after a measurement from the eSense app.

Note: RR and NN interval

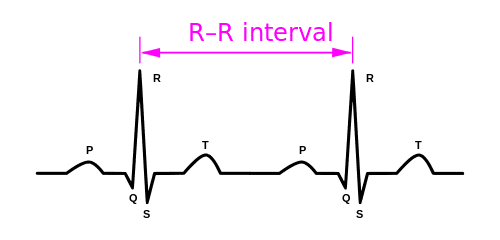
By way of introduction for all measured values, we would like to briefly point out that the terms RR and NN mean the same thing, but are readily used interchangeably in science and literature. The RR, or NN interval, is the interval between two heartbeats, measured in milliseconds.

Put simply, you are training as much variability as possible between these distances. The analysis of this distance data is possible in different parameters, which allow different conclusions about the state of your nervous system.

RR Interval

Time based parameters

SDNN

(“Standard Deviation of the NN Interval”) is the standard deviation of the RR intervals. Simply put, how do the intervals on average deviate from the average of all intervals. Let’s assume you have a value of 68ms. This means, on average, one heartbeat differs from the next heartbeat by 68ms, so it is 68ms earlier or later than the previous one. The greater this value, the higher your overall heart rate variability, this means the better your body can adjust and adapt to changes. You can also see how well the sympathetic and parasympathetic nervous systems work together.

RMSSD

(“Root Mean Square of Successive Differences”) is one of the most important parameters providing information about the activity of the parasympathetic nervous system. It describes the short-term variability of the heartbeat, how much the heart rate changes from one heartbeat to the next. The calculation of the RMSSD value is done like this: The time difference of each successive RR interval is multiplied by itself to obtain only positive values. These intermediate values are summed and divided by the number of RR interval differences to obtain the mean. The square root is taken from the mean of these squared differences. The RMSSD is often also referred to as the value for the body’s ability to recover, or the “brake” of the nervous system. The larger this number is, the better.

Stress Index (SI)

The exact formula is: Stress Index (SI) = AMo / 2Mo x MxDMn. Where AMo is the amplitude of the modal value and reflects the percentage compared to all other RR intervals. Mo (in the formula 2Mo) is the modal value for the duration of an RR interval, which was measured the most. MxDMn is the variability range, or in other words, the difference between the minimum and maximum measured RR interval. This formula calculates how adaptable the heart is or even how high the heart rate variability is. A good balance between sympathetic and parasympathetic nervous systems achieves readings of 30 to 150 points. At 500 – 1000 points, one already assumes limitations in adaptability. Over 1000 points is an indication of high effort or stressful circumstances. Of course, it must also be noted that the SI depends on the situation. It makes a difference whether you sit quietly or exert yourself physically. However, it can be said, at least in general terms, that the lower the stress index (SI), the better. The more rigid and less variable the RR intervals, the greater the stress index.

NN50

The number of pairs of RR intervals that are more than 50ms apart. The larger this number is, the better. However, always compare only sessions of the same length and under the same conditions (e.g. sitting position, before/after sports, morning/evening, …).

pNN50

The percentage of pairs of RR intervals that are more than 50ms apart. The larger this number is, the better. However, always compare only sessions of the same length and under the same conditions (e.g. sitting position, before/after sports, morning/evening, …).

Frequency based parameters

LF („low frequency“)

This is the HRV in the range of 0.04 to 0.15 Hz. This detects vibrations in the range of about 10 seconds. Here, the activity of the sympathetic nervous system is well represented, and in the case of very slow breathing, the parasympathetic nervous system is also represented in the upper range at 0.15 Hz. The higher this value, the more pronounced the sympathetic nervous system is active in the center of gravity.


HF („high frequency“)

This is the HRV in the range of 0.15 to 0.40 Hz. This includes oscillations between 2-7 seconds, in which often falls influence of the heartbeat by respiration (RSA = respiratory sinus arrhythmia). Dazu gehören Schwingungen zwischen 2-7 Sekunden, in die oft eine Beeinflussung des Herzschlags durch die Atmung fällt (RSA = respiratorische Sinusarrhythmie). The greater this value with steady, calm breathing, the more pronounced the activity of the parasympathetic nervous system.


Average RR

The average RR (also sometimes called RR interval or NN interval) is the average interval between two heartbeats. It is thus the reciprocal of the heart rate.

To get a feel for this value, just think of the following 3 examples: If you have a resting pulse of 60 beats per minute, the average RR is exactly 1,000ms or one second (since 1 beat per second). If you are doing light to moderate physical exertion, getting to 120 beats per minute, then the RR is 500ms or half a second (since 2 beats per second). If you are exerting yourself very hard and should get your pulse to 180 beats per second, the RR is 333ms or one-third of a second (since 3 beats per second). There is no better or worse to this value, the larger or smaller. The most that can be said is that the greater the value at rest, the slower your resting pulse, which is a sign of fitness and a strong heart muscle in endurance athletes, for example.


Screenshot 20181205 071432
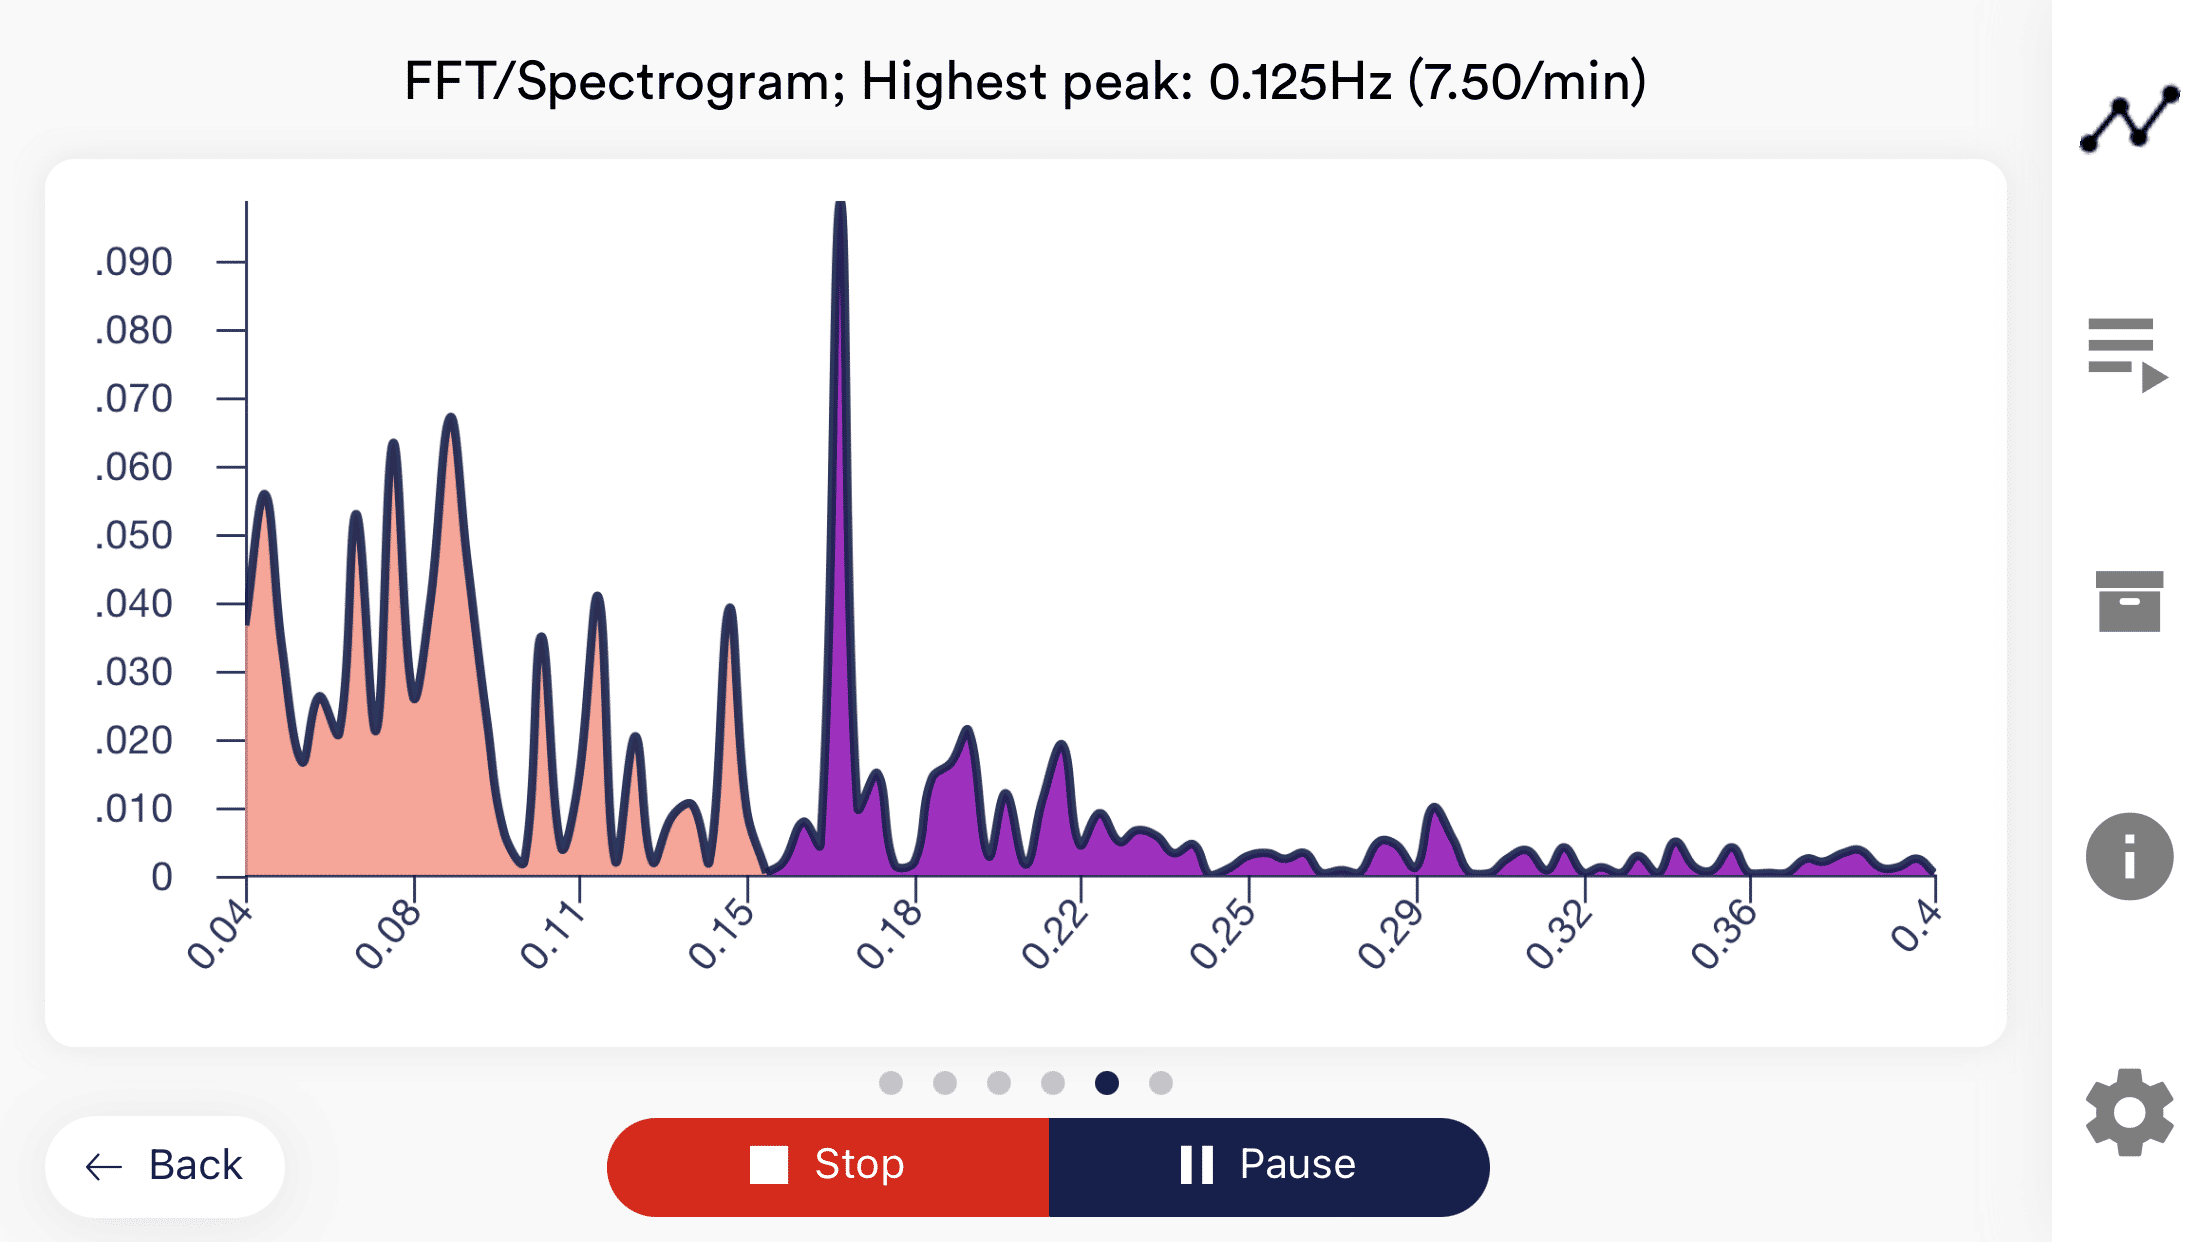
Example representation of a frequency spectrum from the eSense app

Our HRV device: the eSense Pulse

The eSense Pulse determines all parameters presented on this page. However, we have also developed a simple scoring system that you can use to track your progress with biofeedback training. Thus, with the eSense Pulse, you can take either the individual parameters or simply the points as the measured value.